What ROAS Should I Expect from Facebook Ads? (Realistic Benchmarks by Industry)
Stop comparing yourself to cherry-picked case studies. Here are the real Facebook Ads ROAS benchmarks for Shopify stores, broken down by industry.
Get Your Real ROAS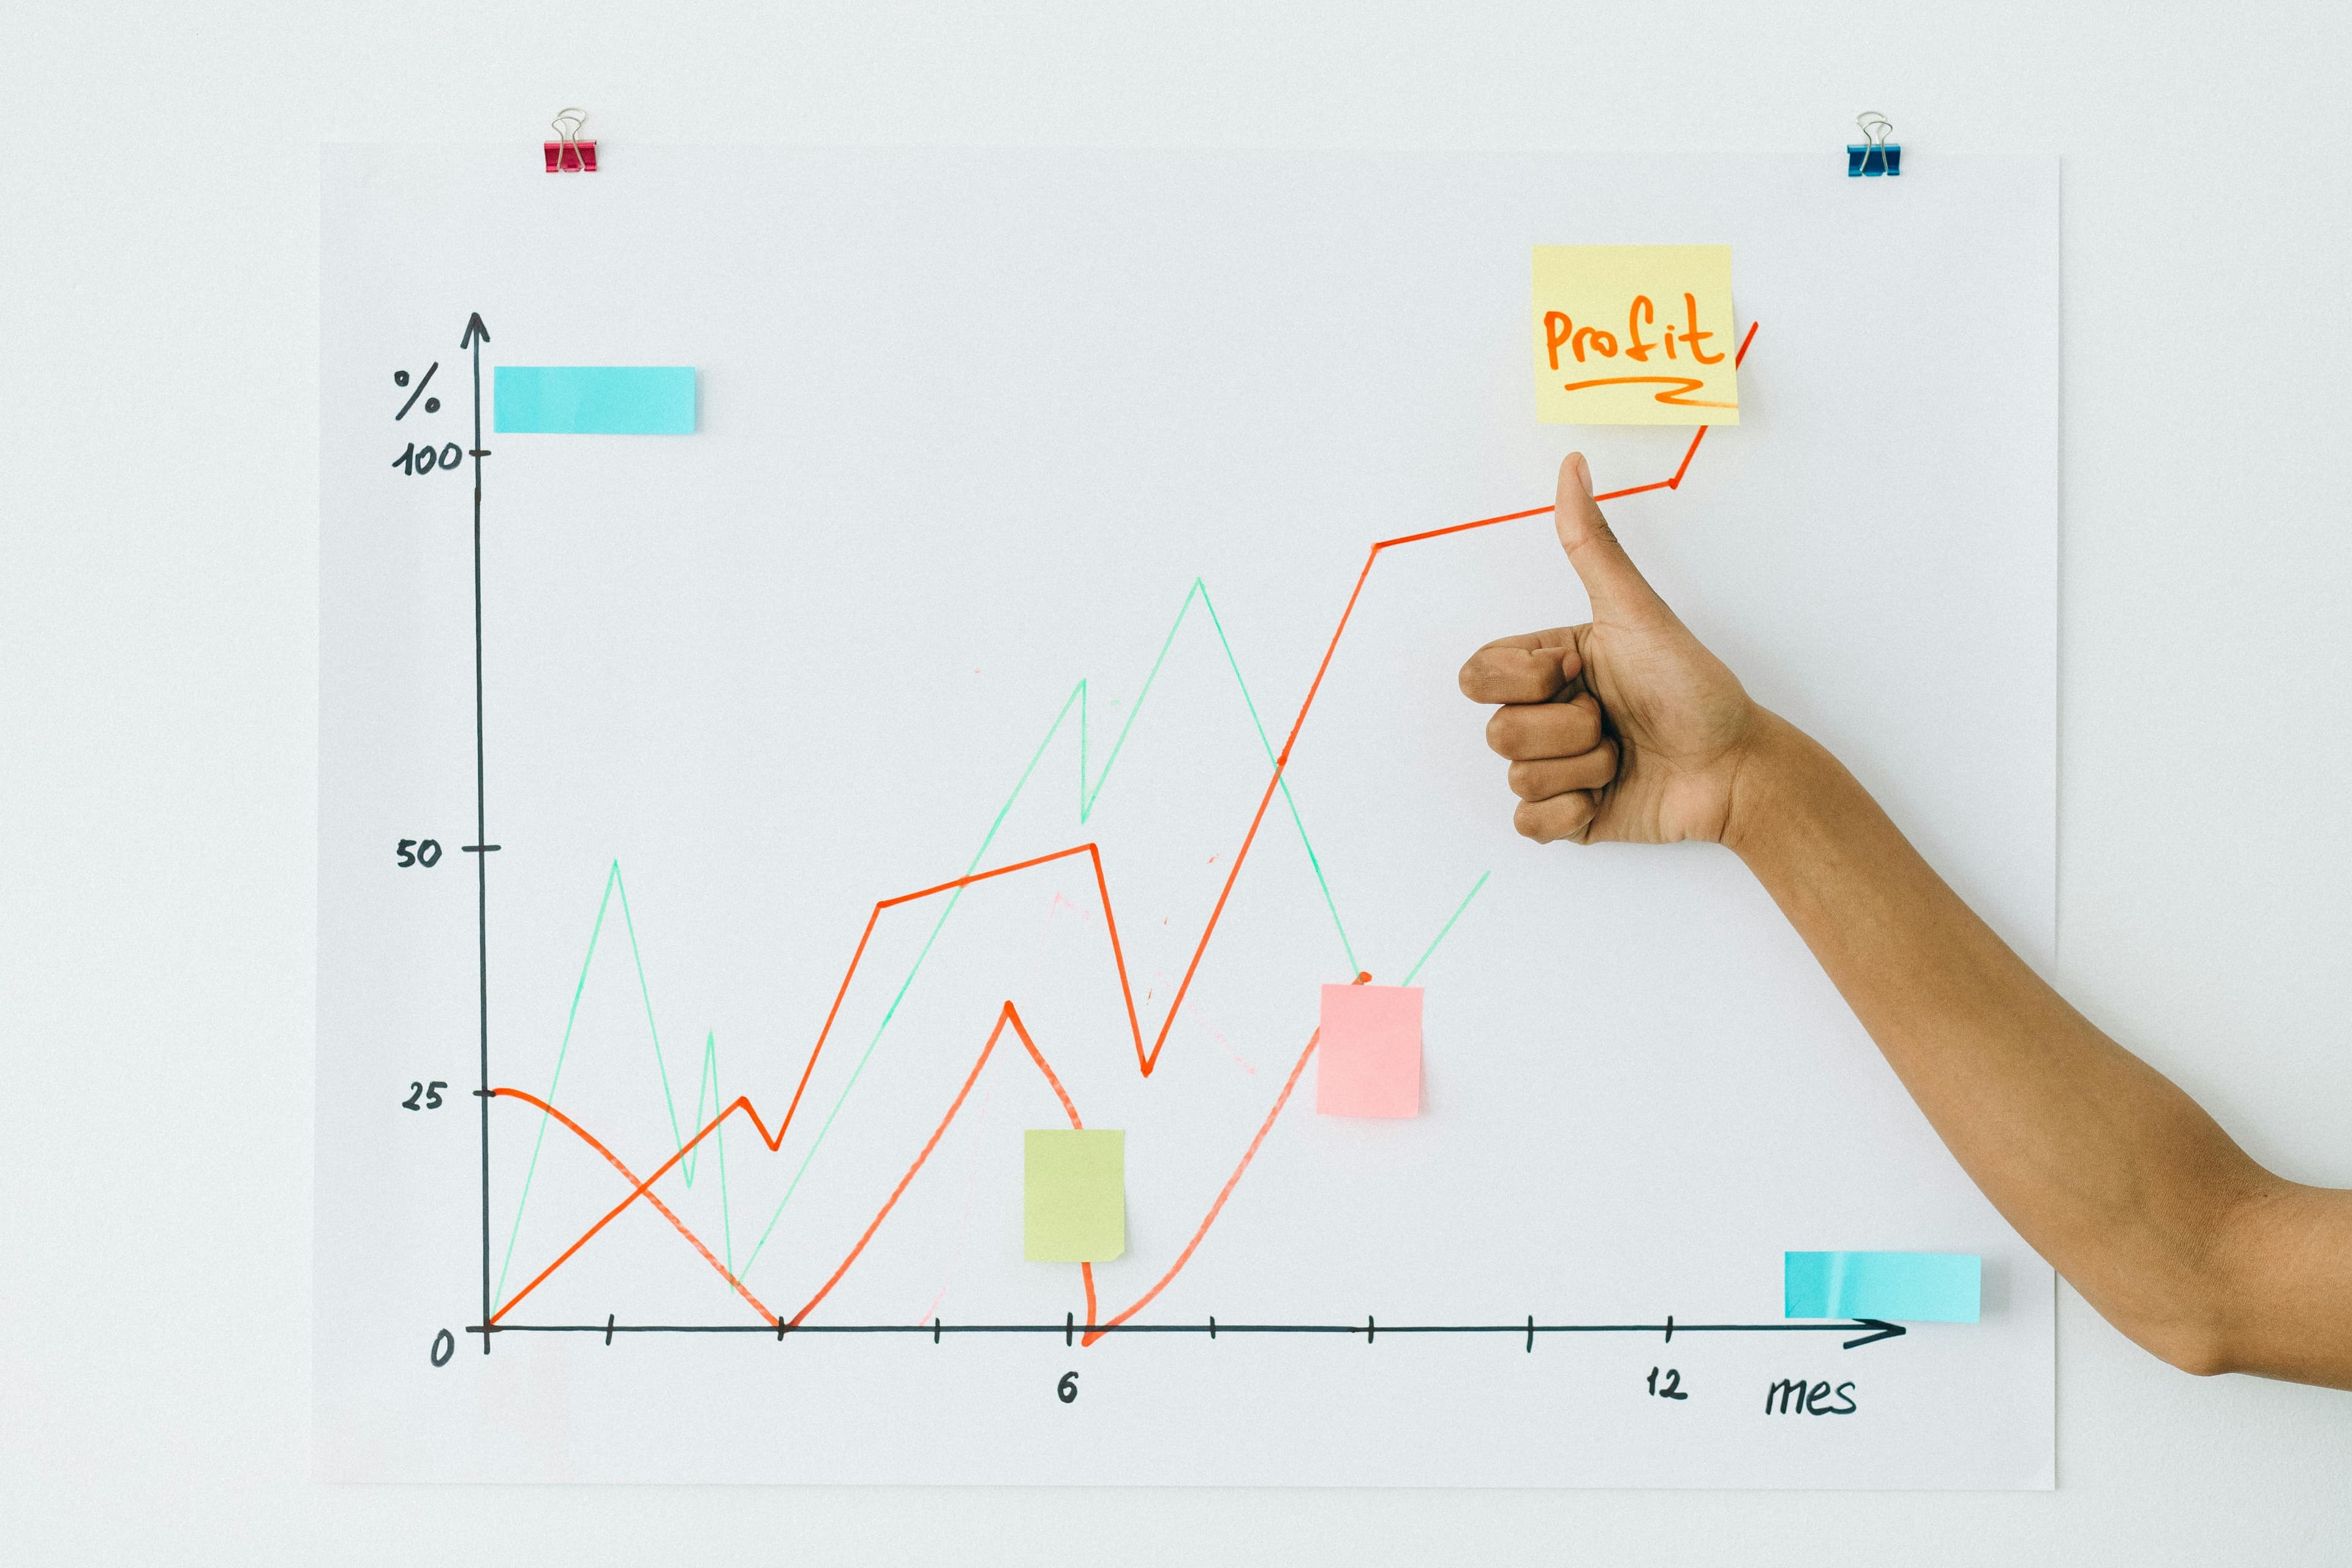
TL;DR
Average Facebook Ads ROAS for Shopify ecommerce stores is 2.5-4.0x. Varies by industry: fashion 3-5x, beauty 3-6x, health 2-4x, electronics 2-3x, home goods 3-5x. Facebook-reported ROAS is typically 30-50% higher than actual due to iOS 14 and attribution overlap.
Facebook Ads ROAS Benchmarks by Industry (2025-2026)
These benchmarks reflect real Shopify store performance data. "Average" is typical for stores with basic optimization. "Good" represents well-optimized campaigns. "Excellent" is top-tier performance with strong creative and audiences.
| Industry | Average ROAS | Good ROAS | Excellent ROAS |
|---|---|---|---|
| Fashion & Apparel | 3.0x | 4.0x | 5.0x+ |
| Beauty & Skincare | 3.5x | 5.0x | 6.0x+ |
| Health & Wellness | 2.5x | 3.5x | 4.0x+ |
| Electronics & Tech | 2.0x | 2.5x | 3.0x+ |
| Home & Garden | 3.0x | 4.0x | 5.0x+ |
| Food & Beverage | 2.5x | 3.5x | 4.5x+ |
| Jewelry & Accessories | 3.0x | 4.5x | 6.0x+ |
| Pet Products | 2.5x | 3.5x | 4.5x+ |
| Sports & Fitness | 2.5x | 3.5x | 4.0x+ |
| Baby & Kids | 3.0x | 4.0x | 5.0x+ |
*These are Facebook-reported ROAS figures. Actual ROAS is typically 30-50% lower due to iOS 14 tracking limitations and attribution overlap.
Why ROAS Alone Doesn't Tell the Full Story
A 4x ROAS sounds great — until you realize your profit margins are only 25%, meaning you need 4x ROAS just to break even. ROAS without context is meaningless.
The number that actually matters is your break-even ROAS. This is the minimum ROAS you need to cover your costs and not lose money on ads.
Break-Even ROAS Formula
Break-Even ROAS = 1 / Profit Margin
If your profit margin is 60%: Break-even ROAS = 1 / 0.60 = 1.67x
If your profit margin is 40%: Break-even ROAS = 1 / 0.40 = 2.5x
If your profit margin is 25%: Break-even ROAS = 1 / 0.25 = 4.0x
This is why a 3x ROAS can be wildly profitable for a beauty brand with 70% margins but money-losing for an electronics store with 20% margins. Always calculate your break-even ROAS before judging campaign performance.
The iOS 14 ROAS Gap: Why Facebook's Numbers Are Wrong
Since iOS 14.5, Facebook's reported ROAS has been significantly inflated for most Shopify stores. Here's why.
About 85% of iPhone users opted out of cross-app tracking, meaning Facebook can no longer see conversions from most iOS users. To compensate, Facebook uses "modeled" conversions — statistical estimates of sales it thinks happened but can't confirm.
The Real Gap: Facebook typically over-reports ROAS by 30-50% compared to actual Shopify revenue. If Facebook says your ROAS is 4x, your real ROAS is likely 2.5-3x. This gap varies by how much of your traffic comes from iOS devices.
This doesn't mean Facebook Ads aren't working — it means the reported numbers aren't accurate. You need an independent attribution source like your Shopify data or a first-party tracking tool to see the real picture.
Ready to see your real attribution?
ROAS by Campaign Type: Prospecting vs Retargeting vs Blended
Your overall ROAS is a blend of very different campaign types. Understanding each one's expected performance helps you set realistic targets.
Prospecting Campaigns (Cold Traffic)
Expected ROAS: 1.5x - 3.0x
These campaigns target people who've never heard of your brand. ROAS is lower because you're paying for brand awareness alongside immediate sales. A 2x ROAS on prospecting is considered good for most industries.
Retargeting Campaigns (Warm Traffic)
Expected ROAS: 5x - 15x
Retargeting campaigns show ads to people who already visited your store. ROAS is much higher because these visitors already know your brand and have shown purchase intent. Don't mistake high retargeting ROAS for overall campaign health.
Blended ROAS (All Campaigns)
Expected ROAS: 2.5x - 4.0x
Blended ROAS combines prospecting and retargeting. This is the number that matters for overall profitability. The industry benchmarks in the table above represent blended ROAS figures.
6 Ways to Improve Your Facebook Ads ROAS
If your ROAS is below the benchmarks for your industry, here are the highest-impact improvements you can make.
1. Fix Your Creative First
Creative is the single biggest lever for Facebook Ads performance. Test UGC-style videos, before/after content, and product demos. Aim to test 3-5 new creatives per week. Most winning campaigns are carried by 1-2 standout ads.
2. Improve Your Landing Page Conversion Rate
Doubling your conversion rate doubles your ROAS without spending an extra dollar on ads. Focus on page speed, mobile experience, social proof, and a clear call to action. A 1% to 2% conversion rate improvement can transform campaign profitability.
3. Increase Your Average Order Value
Higher AOV means higher ROAS at the same CPA. Add bundles, upsells, cross-sells, and free shipping thresholds. Going from a $75 AOV to a $125 AOV can turn a losing campaign profitable overnight.
4. Use Broad Targeting
In 2025-2026, Facebook's algorithm often outperforms manual interest targeting. Test broad targeting (age, gender, country only) with strong creative. Let the algorithm find your buyers — it has more data than you do.
5. Build a Retargeting Funnel
If you're only running prospecting campaigns, you're leaving money on the table. Set up retargeting for site visitors (7, 14, 30 day windows), add-to-cart abandoners, and past purchasers. Retargeting typically delivers 3-5x the ROAS of prospecting.
6. Track Real ROAS With First-Party Data
Facebook's reported ROAS is inflated by 30-50%. Use first-party attribution tracking to see your actual ROAS and make budget decisions based on real data instead of Facebook's estimates.
5 Common ROAS Mistakes Shopify Store Owners Make
1. Comparing to cherry-picked case studies
That guru showing 10x ROAS screenshots is cherry-picking their best campaign on their best day. Overall blended ROAS for profitable stores is typically 2.5-4x. Anyone claiming consistent 8x+ blended ROAS is either lying or counting only retargeting.
2. Not calculating your break-even ROAS
Without knowing your break-even number, you can't judge whether any ROAS is good or bad. A 2x ROAS is amazing for high-margin products and terrible for low-margin ones. Do the math first: Break-even ROAS = 1 / profit margin.
3. Treating Facebook's reported ROAS as gospel
Facebook's ROAS includes modeled conversions, uses its own attribution window, and doesn't account for returns. Cross-reference with your Shopify data. If Facebook says 4x but your Shopify revenue doesn't reflect it, trust Shopify.
4. Killing campaigns with 2x ROAS when break-even is 1.8x
If your break-even ROAS is 1.8x, a campaign delivering 2x is profitable — even if it "looks bad" compared to benchmarks. Many stores kill profitable campaigns because they expect unrealistic ROAS numbers from Facebook Ads gurus.
5. Not accounting for customer lifetime value (LTV)
ROAS only measures first-purchase revenue. If your customers reorder 3x per year, a 1.5x first-purchase ROAS might actually be a 4.5x LTV ROAS. Factor in repeat purchases before judging campaign performance, especially for consumable products.
See Which Channels Actually Drive Your Sales
Facebook says it drove the sale. Your Shopify dashboard tells a different story. Who's right? Neither — both use incomplete data. BlackBox Attribution tracks real customer journeys across every channel with independent, cookie-free tracking built for the post-iOS 14 world — so you see exactly where your orders actually come from.
See Where Your Orders Come FromKey Takeaways
- •Average Facebook Ads ROAS for Shopify ecommerce is 2.5-4.0x, varying significantly by industry from electronics (2-3x) to beauty (3-6x).
- •Your break-even ROAS (1 / profit margin) matters more than industry benchmarks — a 2x ROAS can be profitable or money-losing depending on your margins.
- •Facebook over-reports ROAS by 30-50% due to iOS 14 tracking limitations and modeled conversions.
- •Prospecting campaigns deliver 1.5-3x ROAS while retargeting delivers 5-15x — blended ROAS is what determines profitability.
- •Creative quality and landing page conversion rate are the two biggest levers for improving ROAS.
What Shopify merchants are saying
Reviews from the Shopify App Store
“Great app, easy to install, and way more affordable than the big-name attribution tools. Helps me make smarter decisions about my ad spend. Support has been responsive too. Worth every penny.”
LooksPretty
“This is a good app. I simply tried the app, and I would say it exceeded my expectations. The setup has been very easy and I got some pretty good insights. Support has been very responsive.”
Hustle Wear
“I was skeptical at $19/mo but this thing actually nails attribution better than tools I've paid way more for.”
Sydney Padel Club
Frequently Asked Questions
What is a good ROAS for Facebook Ads on Shopify?
A good Facebook Ads ROAS for Shopify stores is 3x or higher for most industries. The average across all ecommerce is 2.5–4.0x. However, what counts as ‘good’ depends on your profit margins — if your margins are 70%, a 2x ROAS is profitable, but if margins are 30%, you need at least 3.5x to break even.
Is a 2x ROAS on Facebook Ads good or bad?
A 2x ROAS means you’re making $2 for every $1 spent on ads. Whether that’s good depends entirely on your profit margins. If your product margins are 60%+, 2x ROAS is profitable. If your margins are 40% or less, 2x ROAS means you’re losing money after accounting for product costs, shipping, and overhead.
Why is my Facebook Ads ROAS getting worse over time?
Common causes include audience saturation (showing ads to the same people too often), creative fatigue (same ads losing effectiveness), increased competition driving up CPMs, iOS 14 tracking degradation showing fewer conversions, and seasonal fluctuations in ad costs.
How do I calculate my break-even ROAS?
Break-even ROAS = 1 / profit margin. If your average profit margin (after COGS, shipping, and transaction fees) is 40%, your break-even ROAS is 1 / 0.40 = 2.5x. Any ROAS above 2.5x is profitable; anything below means you’re losing money on that campaign.
Does Facebook Ads ROAS account for returns and refunds?
No. Facebook reports ROAS based on initial purchase value only. It does not subtract returns, refunds, or chargebacks. Your actual ROAS is typically 5–15% lower than what Facebook reports, depending on your return rate. Use Shopify-side data or an attribution tool like BlackBox for accurate post-return ROAS.